
Most local SEO reports still treat the average ranking as the headline result. That advice sounds sensible, but a blended position across a town, city or service area rarely explains why one branch receives calls while another receives none. A listing can appear prominently in Maps and still fail commercially if its profile is incomplete, its reviews look stale or customers can't find a clear next action.
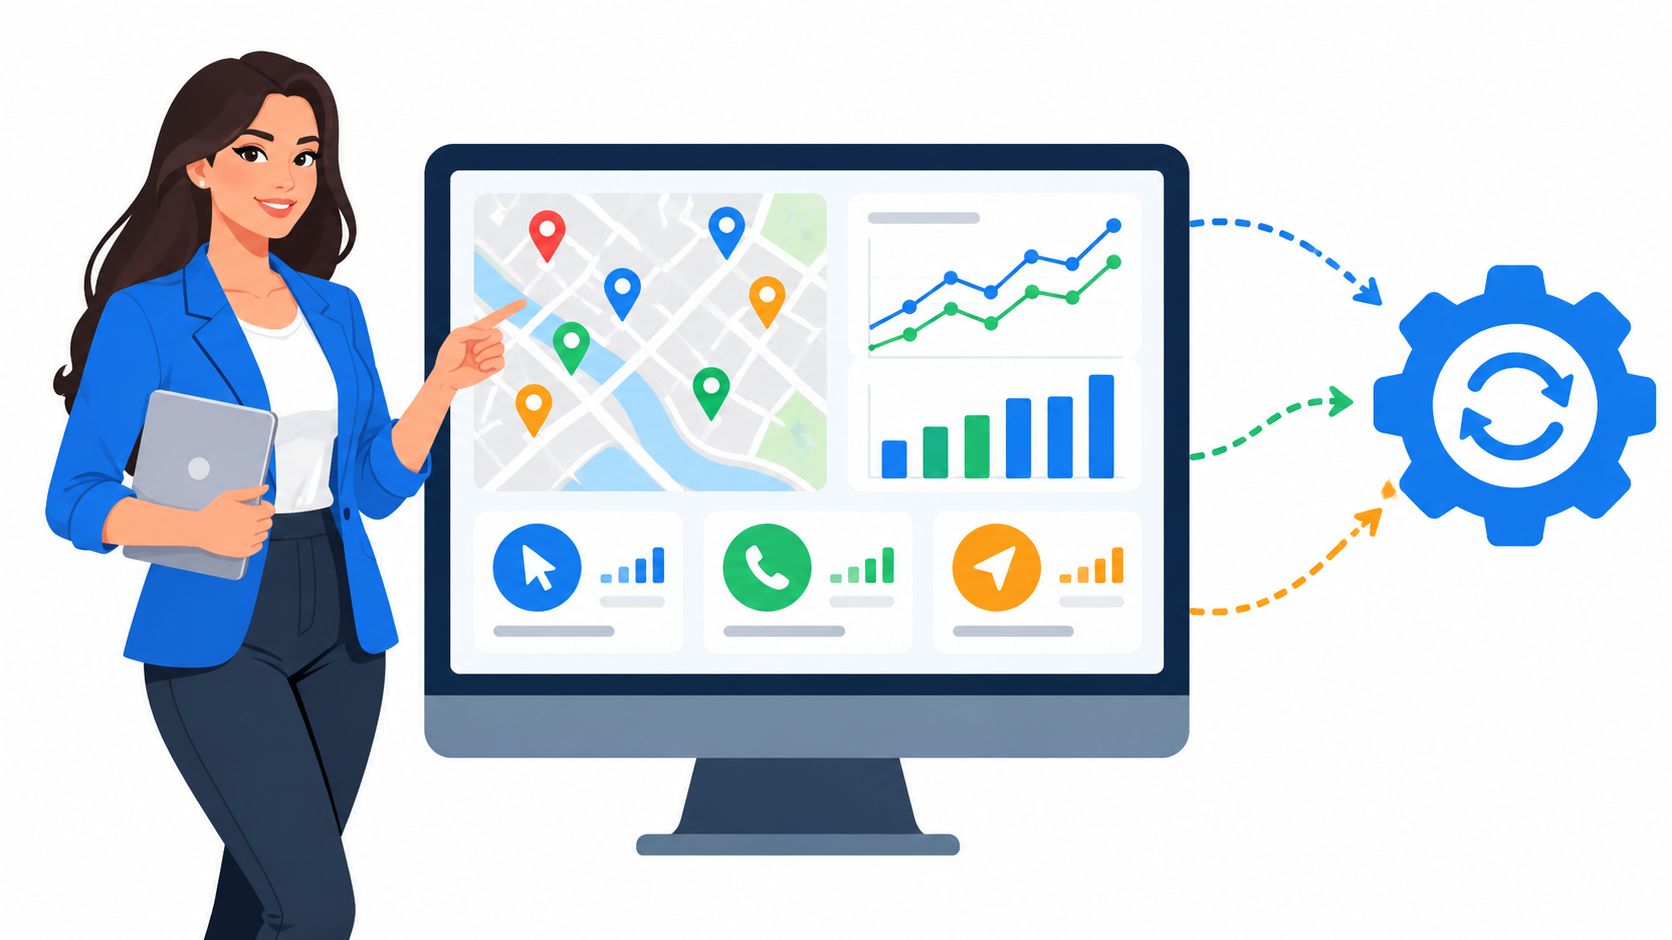
Useful local SEO reporting starts with a harder question: what did visibility produce? Google Business Profile reporting makes that question practical by exposing views, search queries, website clicks, calls and direction requests, with downloadable reports covering up to six months of data in Google's Performance area across Search, Maps and Business Profile Manager (Google's reporting documentation). For a multi-location operator, that shift replaces a ranking scorecard with a branch-level view of discovery, trust and customer action.
Why Average Rankings Fail Local Businesses
An average ranking can make a multi-location business look healthy while hiding weak branches. A self-storage facility may rank well near its entrance but poorly across surrounding postcodes. A service-area business may appear for branded searches yet remain difficult to find for generic terms such as “storage units near me”. An account-level average blends these outcomes into a number that cannot show which locations deserve attention.
Rank tracking still has a practical role. It can show whether a target query is moving, whether a competitor has displaced a branch, and whether a local landing page is gaining visibility. Its value comes from diagnosis. The ranking may be healthy; the reporting model is what failed to capture the commercial outcome.
Visibility is not the same as demand
A position records where a business appeared for a particular search setup. It says nothing about whether the searcher trusted the listing, clicked through, called, requested directions or selected a competitor. Google Business Profile data supplies those interaction signals directly, including search queries, views, website clicks, calls and direction requests, as covered in Google's Performance reports above.
That distinction matters in the UK because nearby searches often carry immediate intent. Google and Ipsos data cited in UK local SEO summaries reports that 76% of people searching for something nearby on a smartphone visit a related business within a day, and 28% of nearby searches end in a purchase (UK local SEO statistics from RankCraft). A position-only report stops at discovery and misses the commercial action that may follow.
Practical rule: Use rankings to investigate visibility, then use profile actions and lead data to judge performance.
A strong local-pack position can still produce few enquiries when the profile leaves customer questions unanswered. For self-storage, the gaps may involve access details, opening information, photography, booking options, or reviews that fail to address security and convenience. Those issues can suppress action even when visibility looks positive.
Replace the ranking headline
A useful report pairs every visibility measure with behavioural context:
- Local-pack visibility shows whether the branch appears among relevant competitors.
- Search queries reveal how customers describe their need and whether discovery is branded or generic.
- Profile views measure exposure, but require interaction data for interpretation.
- Calls, website clicks and direction requests indicate whether discovery led to a meaningful action.
- Review activity and profile completeness add context for trust and click-through behaviour.
Google Business Profile optimisation belongs in the reporting workflow here. Judge optimisation work by whether it improves the quality of discovery and the actions available afterwards, rather than by whether a checklist was completed.
A branch with fewer views but more direction requests may be reaching higher-intent users. Another with more views but falling calls may have a relevance, trust or conversion problem. Average rankings cannot separate those cases. Location-level interaction reporting can.
Selecting KPIs That Connect Visibility to Revenue
A ranking report can look healthy while branches generate little business. A KPI deserves space only when it answers a commercial question: did more people call, request directions, visit a pricing page or complete a booking, and which location produced that action?
Separate the reporting model into discovery, trust, engagement and commercial outcome. Discovery shows how customers found a profile. Trust indicates whether the listing provided enough confidence. Engagement records the next action. Commercial KPIs connect those actions to qualified enquiries, bookings or revenue.
Start with the business decision
Set a purpose for each location before choosing metrics. A staffed retail site may prioritise calls and direction requests. A self-storage branch may need calls, visits to pricing pages and completed booking actions. A mobile service business may rely more on enquiry forms and phone calls than physical directions.
Local keyword research helps define the search themes behind those KPIs. Separate branded discovery from generic service demand. Branded searches often reflect existing awareness, while generic searches can indicate demand that the branch has not yet captured.
| Metric Category | Specific KPIs | Business Question Answered |
|---|---|---|
| Discovery | Search queries, profile views, Maps visibility, branded and non-branded demand | Can local customers find the right branch for the relevant service? |
| Trust | Profile completeness, review volume, review recency, rating and response activity | Does the listing give prospects enough confidence to act? |
| Engagement | Website clicks, calls and direction requests | What did people do after seeing the profile? |
| Commercial outcome | Qualified calls, forms, bookings and revenue-linked actions | Did local visibility produce a meaningful business result? |
| Coverage | Location, postcode cluster, service area and query-theme performance | Which areas need investment, testing or operational attention? |
Treat reviews as context, not a trophy
Review quantity alone is not a revenue KPI. Review reporting becomes useful when it includes recency, response behaviour, recurring themes and branch-level actions. Consumers commonly read Google reviews before choosing a local business, and complete profiles can be perceived as considerably more reputable. These signals justify monitoring trust, but they do not prove that additional reviews caused more bookings.
Compare review and profile changes with calls, clicks, directions and qualified enquiries. A branch with improving trust metrics but no commercial lift may have another constraint, such as pricing, opening hours, weak landing-page relevance or poor phone handling. The report should make that gap visible rather than presenting reputation as a success measure by itself.
External research can support agency prospecting by identifying businesses with incomplete profiles or weak location coverage. A practical overview of best lead scraping tools can help structure that work, but scraped prospects are not first-party performance data. Keep the client report grounded in verified Google Business Profile records, analytics, call tracking and CRM data.
Keep vanity metrics in their place
Impressions and rankings remain useful leading indicators. They become vanity metrics when they appear without a decision, comparison or action attached. Pair each KPI with an owner and a response, such as improving a branch profile, revising a location page, investigating missed calls or reallocating content work towards a weak postcode cluster.
A report should show the path from local discovery to business value. That makes location performance comparable without allowing network totals or headline rankings to hide commercial weaknesses.
Extracting and Segmenting Multi-Location Data
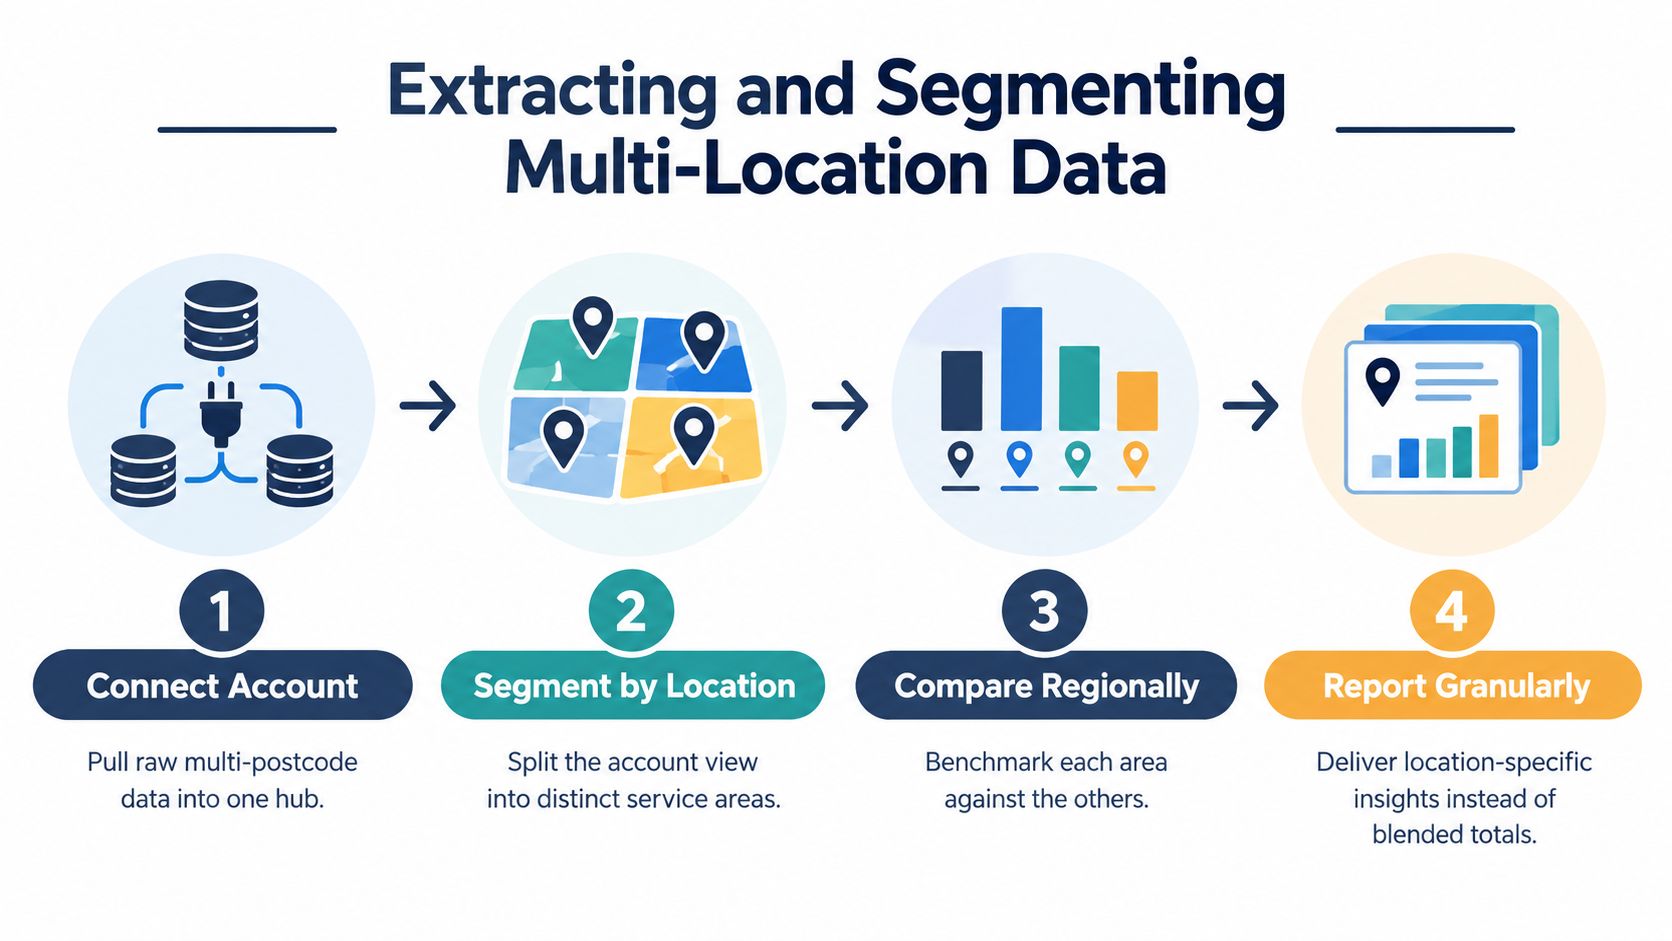
The most damaging reporting error for a multi-location business is aggregating data before checking each branch. A flagship site can dominate network totals while smaller locations lose visibility, calls and enquiries. Treat every branch as the basic reporting entity from the first export.
Google supports selecting a reporting period, downloading profile data and exporting multiple locations for spreadsheet comparison through Google's multi-location download guidance. The export becomes useful only when each record retains its profile, timeframe and location fields.
Build the raw data structure first
Set up the data before designing charts:
- Define each profile as an entity. Assign every branch a stable name, address identifier, service area, opening-hours reference and reporting owner. Avoid informal labels that change between teams.
- Export identical date ranges. Use the same period for every location so partial months are not compared with complete ones.
- Preserve action types. Store calls, website clicks, direction requests, views and queries in separate fields. A single “engagement” total hides useful differences in customer behaviour.
- Record operating differences. Include service area, opening hours, branch format, temporary closures and relocations. A site with restricted hours needs context when compared with a fully staffed branch.
- Segment query themes. Separate branded terms, generic service terms, “near me” demand and location-modified searches. This shows whether a branch is capturing existing awareness or generating new demand.
- Benchmark within the network. Compare like-for-like branches and inspect outliers before producing account totals.
The spreadsheet should answer, “Which branch changed?” before, “How did the account perform?” That sequence keeps a high-performing site from concealing a commercial problem elsewhere.
Want a free audit like this for your own site?
We'll show you exactly what's holding your rankings and conversions back. No sales pitch.
Get My Free AuditUse geography that reflects how customers search
Town names can be too broad for operational decisions. A self-storage operator may need to compare branch, postcode area and nearby settlement performance because customers search around where they live or work, rather than around the facility's legal address. That comparison also depends on well-structured local landing page SEO for each settlement.
Grid-based visibility can reveal differences across a few kilometres. UK-focused reporting guidance recommends using 30+ point heatmaps in some local tracking programmes through LocalHQ's keyword ranking reporting guidance. The grid should reflect the service area and the decision being made. A dense urban branch may need tighter points than a rural facility serving dispersed communities.
Document the radius, point locations and query set so monthly comparisons remain meaningful. A blended average can sit in an executive summary, but it should not replace branch tables. Operations teams need to see which profile requires review work, which page needs improved relevance and which area has demand but weak conversion.
Building Dashboards That Tell a Cohesive Story
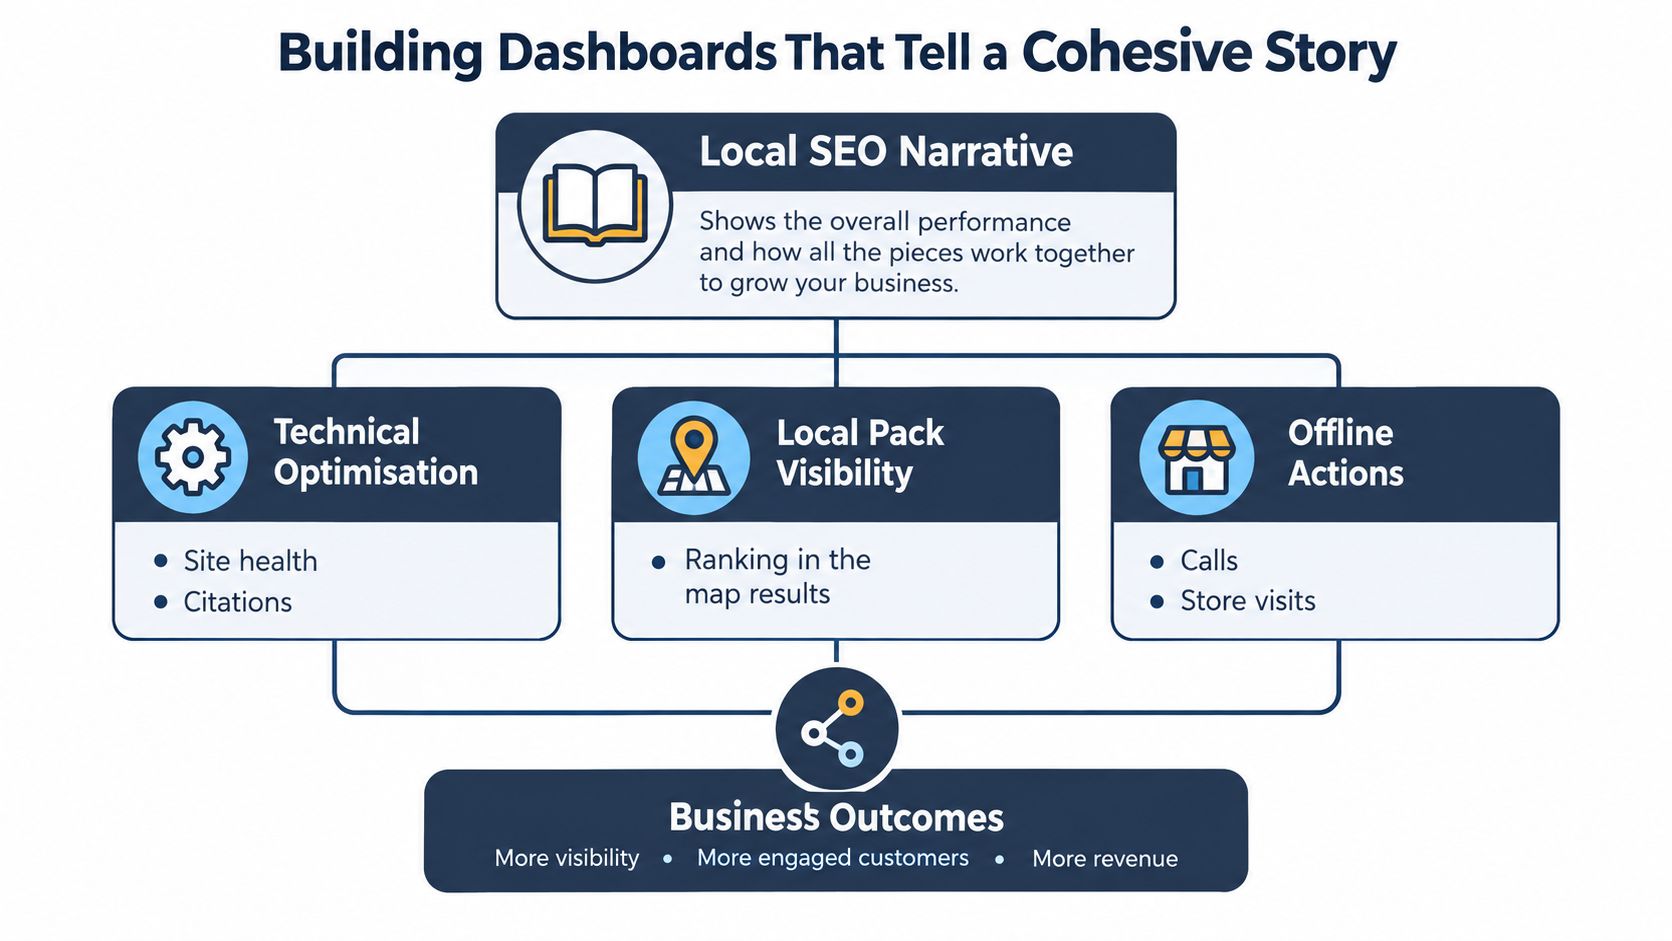
A dashboard should let a reader move from cause to outcome without opening five separate reports. The narrative usually starts with technical conditions, moves through local visibility and ends with customer action. If those layers sit in unrelated tabs, stakeholders must create the explanation themselves.
Arrange the dashboard around decisions
The first screen should answer whether local visibility is creating useful demand. It can show a concise account summary, followed by branch-level action trends and a clear note about the largest movement. It shouldn't lead with a wall of technical checks.
A practical hierarchy has three layers:
- Technical foundation: profile completeness, location-page health, indexation, opening information and listing consistency.
- Local visibility: query themes, local-pack movement, Maps exposure, branded versus non-branded demand and geographic coverage.
- Offline and onsite actions: calls, direction requests, website clicks, forms, bookings and qualified leads.
Search Console can add organic clicks and query context, while GBP contributes profile actions. Analytics or a CRM should connect those visits and calls to lead status where the implementation supports it. The purpose isn't to force every source into one number. It's to show where the signals agree and where they conflict.
A useful dashboard design should be informed by reliable KPI dashboard design, particularly the principle that visual components need a clear decision purpose. A chart that doesn't change an action belongs in a secondary view or should be removed.
Make segmentation visible
Every major chart should offer a location filter. The reader should be able to compare branches, postcode clusters, service areas and query themes without downloading a separate file. Branded and non-branded demand should remain distinct because they represent different strategic conditions.
Heatmaps are valuable when they explain geographic variation rather than decorate the report. Pair a visibility grid with actions by location. If a branch ranks across its grid but receives weak calls, the issue may sit in the listing or sales process. If calls are strong while visibility is patchy, the branch may be converting a narrow high-intent pocket and could benefit from broader area coverage.
A good dashboard doesn't hide complexity. It places complexity behind a clear decision.
Write the explanation beside the chart
Each reporting cycle should include a short interpretation for every material movement:
- What changed? Identify the branch, query group and action type.
- Why might it have changed? Note relevant profile, review, page, operational or seasonal context without claiming causation that the data can't prove.
- What happens next? Assign a specific test, investigation or optimisation.
This format keeps the report honest. A ranking increase with no action improvement becomes a conversion question, not an automatic success story.
Interpreting Data for Niche and Storage Markets
Self-storage exposes the weaknesses of shallow reporting because the customer journey can begin with a broad local search and end with a highly practical action. A person may compare unit size, access, security, price and distance before calling. Another searcher may already know the brand and use Maps only to confirm the route.
Consider a fictional storage operator with branches serving several postcode clusters. One branch records fewer Maps views during a reporting period, yet its direction requests rise. A weak report labels the visibility change as negative. A useful report checks whether the remaining views came from stronger local-intent queries, whether the branch changed its opening hours, whether a nearby competitor closed, and whether customers used the website or phone instead of requesting directions.
Read conflicting signals as clues
The combination of metrics matters more than any isolated movement:
| Observed pattern | Plausible interpretation | Reporting response |
|---|---|---|
| Views rise, calls remain flat | More exposure isn't producing trust or intent | Review profile messaging, reviews, offers and call handling |
| Views fall, direction requests rise | A smaller audience may be more location-ready | Examine query mix and compare with branch capacity |
| Rankings improve, website clicks decline | Searchers may be completing discovery in Maps | Check calls, directions and booking paths before judging the change |
| Non-branded visibility grows, enquiries don't | Coverage has expanded without sufficient relevance | Compare landing-page intent, pricing clarity and branch response |
| Reviews increase, actions remain unchanged | Trust activity alone hasn't solved the conversion barrier | Inspect service information, availability and the customer journey |
The report shouldn't claim that one metric caused another without supporting evidence. It should identify the most credible explanation and state what data or operational check would confirm it.
Match the query to the customer need
“Storage units near me” indicates a location-led need, but it doesn't explain urgency, size or budget. A branch report can group queries by intent, such as generic storage, vehicle storage, business storage, student storage and brand searches. The content and profile strategy can then reflect the strongest unmet theme in each area.
A town-centre branch may need a location page that clarifies access and transport. An out-of-town facility may need stronger route information, vehicle access details and visibility across surrounding settlements. Both branches can rank for the same broad service, yet their conversion barriers differ.
For storage operators: Direction requests are especially meaningful when the facility depends on physical access, but calls and bookings should remain separate measures because they represent different stages of intent.
The commercial interpretation also requires offline context. A branch undergoing refurbishment, operating reduced hours or reaching capacity may produce unusual actions that SEO alone can't explain. Local SEO reporting should flag those conditions instead of treating every movement as an algorithmic outcome.
Automating the Workflow and Presenting Insights
Automation should remove repetitive handling, not remove judgement. Scheduled exports, connectors and reusable dashboard templates can keep the data pipeline consistent, while a strategist still needs to check location mapping, date ranges and unusual movements before a report reaches a client.
Standardise the process
A scalable workflow can follow this sequence:
- Schedule data pulls. Collect GBP, Search Console, analytics, rank-tracking, review and CRM data on a consistent cadence.
- Validate the inputs. Check that every branch appears, date ranges align and action fields haven't changed.
- Refresh location mappings. Keep profile names, postcodes, service areas and branch status consistent across sources.
- Apply the dashboard template. Use the same core structure, but allow branch-specific notes and comparisons.
- Add the insight summary. State what changed, which locations require attention and what action follows.
- Deliver by audience. Send executives the commercial summary, managers the branch detail and specialists the diagnostic view.
A platform such as Amax Marketing's local SEO service can sit alongside these systems where a business needs ranking, call and direction-request tracking with recurring reporting. The tool choice matters less than preserving the connection between profile visibility, customer actions and qualified outcomes.
Automate delivery, retain review
Automated delivery can distribute dashboards to decision-makers, but a report shouldn't be sent without quality assurance. Before delivery, the reporting owner should confirm:
- Coverage: Every active location is present and correctly labelled.
- Comparability: The selected periods, query groups and operating conditions are aligned.
- Attribution: Calls, forms and bookings are identified consistently, with limitations stated.
- Segmentation: Branch, postcode and branded versus non-branded views are available.
- Interpretation: Each significant movement has a plain-English explanation and next action.
- Commercial relevance: The report distinguishes exposure from meaningful customer behaviour.
AI-assisted workflows can help classify query themes, draft summaries and flag anomalies, provided a human checks the output against source data. A practical guide to AI SEO workflows can help teams think through that division of labour. Automation may identify that one branch changed sharply, but it can't reliably infer whether a closure, capacity issue, competitor change or profile edit caused the result without operational context.
Senior stakeholders rarely need every chart. They need a concise account of what local visibility produced, which branch is underperforming, why the movement matters and what the team will do next. That is the standard that turns local SEO reporting from a monthly data dump into an operating tool.
Amax Marketing helps multi-location and niche businesses connect local visibility with rankings, calls, direction requests, traffic, conversions and revenue through structured reporting and local SEO strategy. Visit Amax Marketing to discuss a location-level audit and build a reporting workflow that shows what each branch is producing.